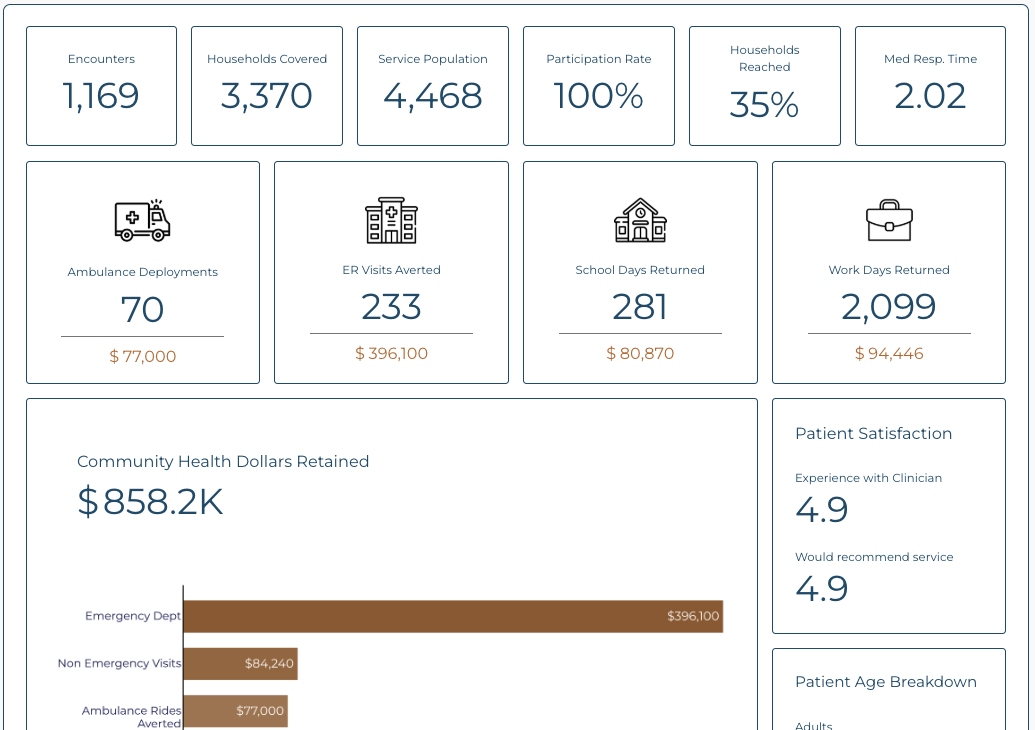
What the top numbers mean
“Community Health Dollars Retained”
Time back to school & work
Who we’re reaching
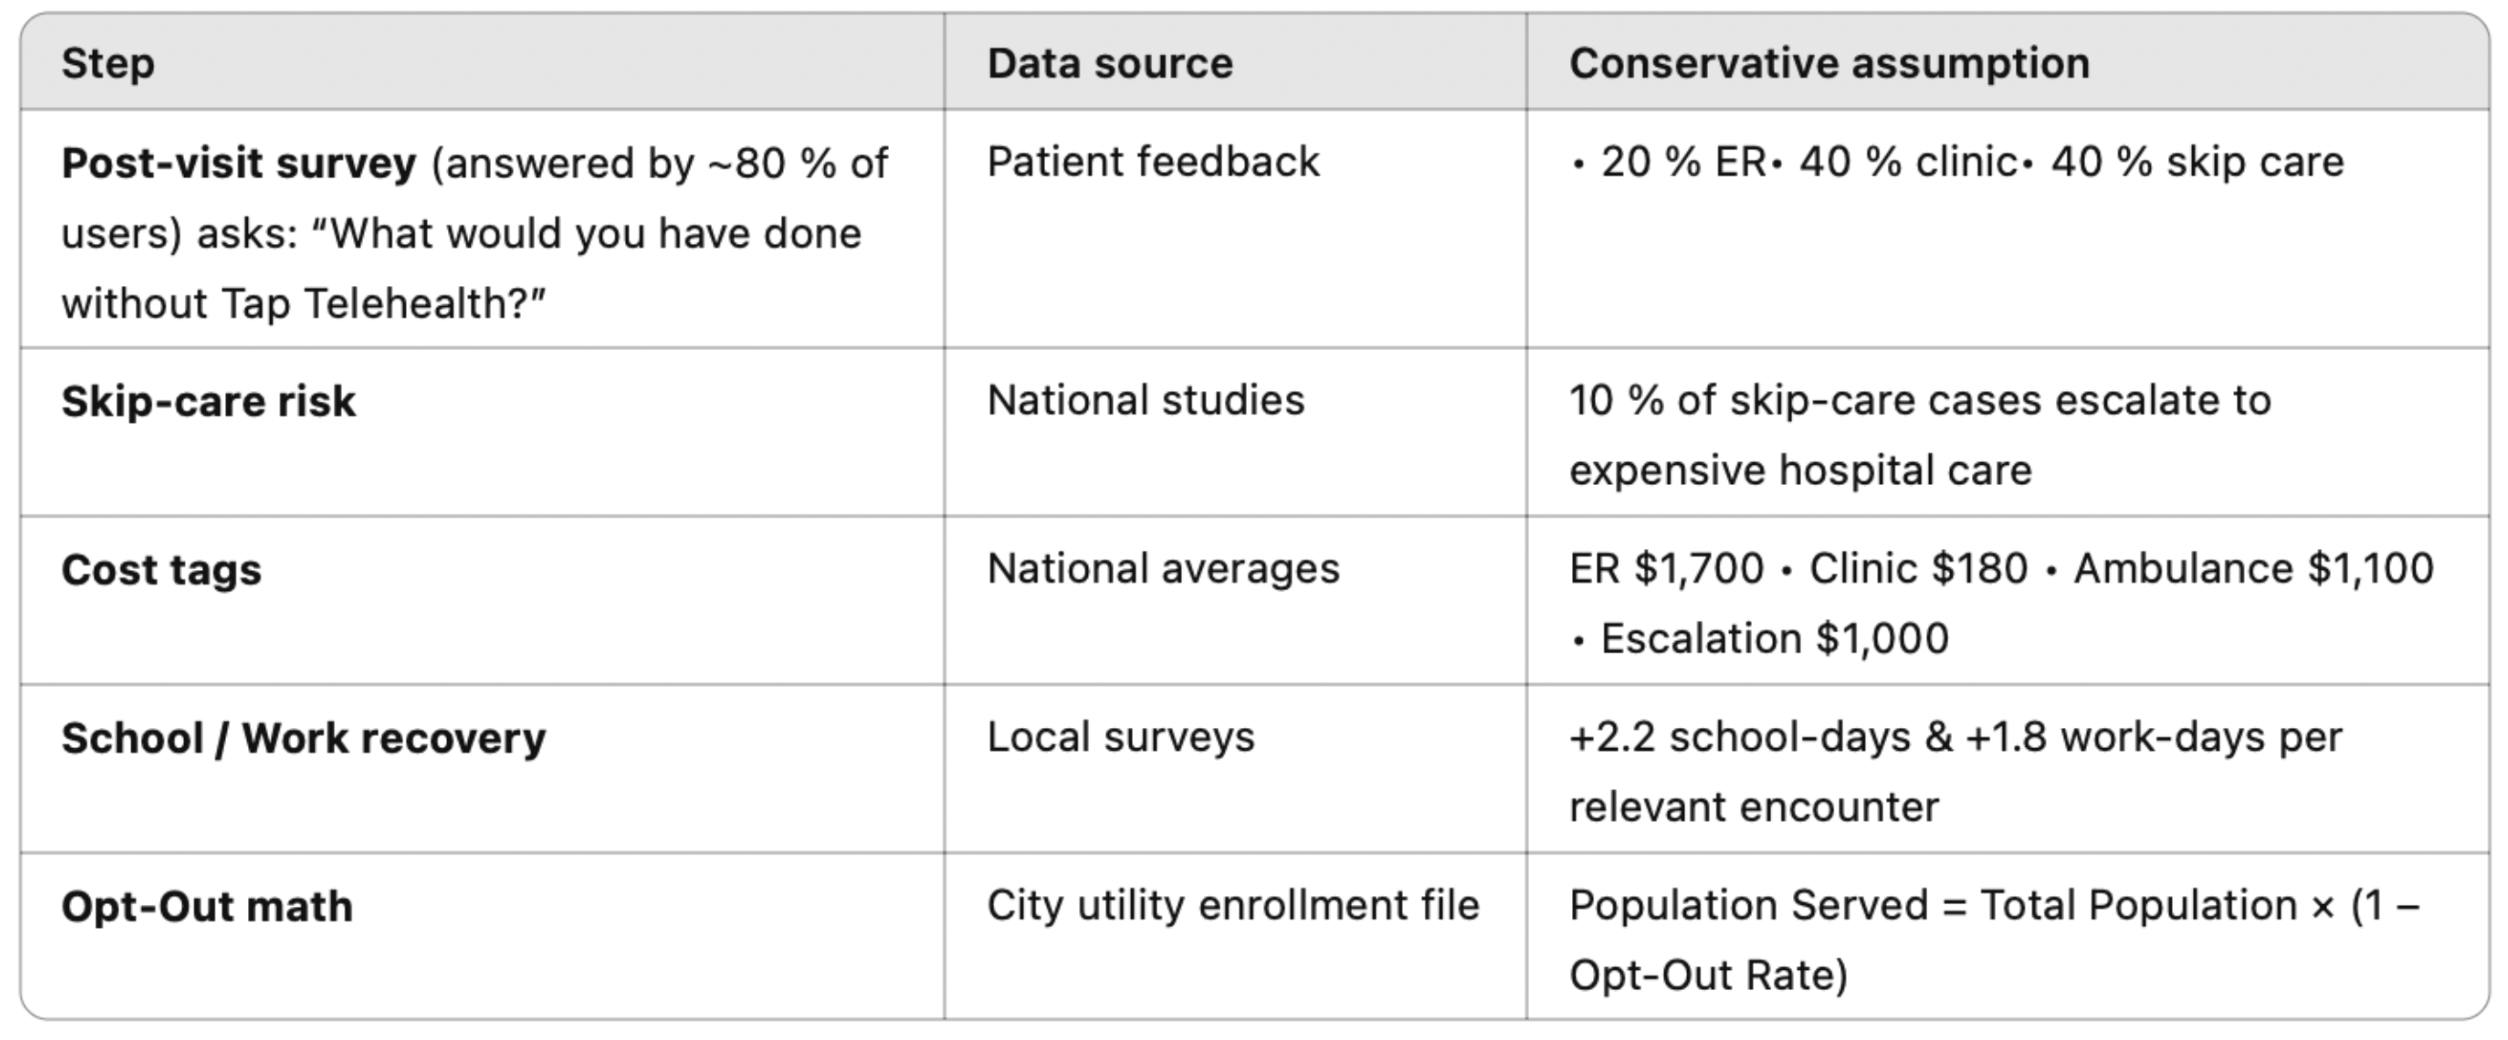
How we do the math